Human Plague Cases
During 1926–2003, a total of 565 plague cases, including 2 cases of plague carriers, were registered in 82 foci (3–6,8–10,15). We included those cases in the analysis of epidemiology of plague in Kazakhstan. The last known case occurred in 2003. Plague outbreaks have been registered in 10 of 20 natural plague foci (3–6,8) (Table 1).
During the 1950s through the 1970s, mass field teams worked in Kazakhstan and identified areas with stable and suspected plague epizootics (1,2,4). Almost all studied human plague cases overlapped with areas of stable plague epizootics (3) (Figure 2).
During the study period, human plague cases were registered in the regions of Almaty (32.22% of all cases), Aktobe (1.59%), Atyrau (4.42%), Mangystau (21.24%), and Kyzylorda (40.53%). The incidence rate (IR) for all cases registered during the study period was 0.29/10,000 population. The IR per 10,000 population by region was 0.52 in Almaty, 0.05 in Aktobe and Atyrau, 1.11 in Mangystau, and 0.27 in Kyzylorda (Figures 3, 4).
At the beginning of the 20th Century, many plague cases were reported, and then cases decreased. We noted 3 plague peaks during the study period (Figure 5). The first peak occurred during 1926–1948 in the west and south, where 82% of all cases were reported. For example, in 1 outbreak in Kyzylorda oblast in 1945, more than one third (37.4%) of the population became ill with plague. Those epidemics required the organization of scientific and methodology centers in Central Asia. By the Order of the Ministry of Health of the USSR, No. 739, dated December 9, 1948, and January 1, 1949, the Almaty Anti-Plague Station was transformed into the Central Asian Research Anti-Plague Institute of the Ministry of Health of the USSR, later renamed M. Aikimbayev National Scientific Center for Especially Dangerous Infections (NSCEDI) of the Ministry of Health of the Republic of Kazakhstan. NSCEDI conducted research work on plague; produced diagnostic preparations; and provided scientific, methodological, and operational guidance on the organization and implementation of a set of sanitary and prophylactic measures for plague control stations in Kazakhstan and other Central Asia republics. In addition, during 1947–1948, the Public Health Service of Kazakhstan began to use antibiotic drugs to treat plague, vaccinate the population to prevent the disease, conduct sanitary and preventive work against plague, and conduct epidemiologic field studies. After those measures were applied, plague incidence rapidly decreased.
The second plague period occurred during 1955–1989, which accounted for 13.0% of all cases during the analyzed period. Few cases were reported during that time, but a slight increase was noted during 1961–1967 related to the slaughter of plague-affected camels. During those years, 6.37% of the population contracted plague, among whom 75.0% were infected through contact with sick camels. At one time, dozens of persons participated in the slaughter of camels, and all could have contracted plague at the same time. Then, the government issued an order stating that camel owners could receive compensation if their camels were infected with plague and the owners reported infected camels to the authorities. That order contributed to the reduction of cases involving sick camels (1,3,4).
A third period of increasing incidence occurred during 1990–2003, which accounted for 5.0% of all cases during the analyzed period. During that time, the Soviet Union collapsed, infrastructure was destroyed, and the economy in Kazakhstan deteriorated. Epidemiologic surveillance of plague was not fully funded and could not cover all plague endemic areas. After the economic situation of the country improved, plague incidence decreased, and the last case was registered in 2003 (Figure 5).
Most plague cases were reported in the months of January, August, September, October, and November (Figure 6). January, October, November, and December cases occurred during major outbreaks recorded in 1926, 1929, 1945, 1947, and 1948, and plague was spread by humans during those outbreaks (Figure 6).
During the study period, we noted multiple clinical forms of plague. Among reports we found 12.57% bubonic, 5.84% bubonic septicemic, 1.06% bubonic pneumonia, 72.4% pulmonary, 0.35% secondary pneumonia, 2.83% septicemic, 0.18% cutaneous, 0.88% cutaneous bubonic, 0.35% tonsillar, and 0.18% tonsillar bubonic forms; 3.36% of cases had no clinical form data. We also observed that 71.15% of plague infections occurred from person-to-person transmission. Other infection sources included fleas (12.39%), camels (12.39%), hares (0.88%), aerosols (0.53%), foxes (0.35%), rodent bites (0.18%), saiga antelope (Saiga tatarica) (0.18%), and feral cats (0.18%); 1.77% of cases had no available transmission data.
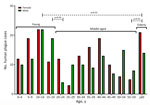
Among case-patients, we noted 3 age subgroups: young (0–19 years of age), middle (20–59 years of age), and older (>60 years of age) (Figure 7). When we analyzed age and sex distribution, we found that female and male persons were at equal risk for plague infection. However, we found age differences for both sexes in the young, middle, and older age groups (Figure 8). Most cases among female persons were registered in 8 different age groups. The highest number of cases for both sexes was observed in the 10–14-year age group. The highest number of cases in women was observed in the >60-year age group and for male persons in the 15–19-year age group. The lowest number of cases among women was observed in the 25–29-year age group and among men in the 20–24-year age group (Figure 8).
In 1913, human plague epidemics began to be documented by using descriptive epidemiology and microbiology (12). Cases were confirmed on the basis of epidemiologic, clinical, serologic, and bacteriologic data. Most human plague cases were confirmed by bacteriologic methods and isolation of Y. pestis (Table 2).
We noted that higher mortality rates were recorded in 1926, 1927, 1929, 1945, and 1948 (Figure 9). In total, ≈26% of patients recovered from plague. Areas with higher mortality rates included Mangystau oblast in 1926, 1927, and 1948; Alma-Ata in 1929 and 1948; and Kyzylorda oblast in 1945.
During the study period, the IR was 0.01–56.1/10,000 population, and case-fatality rates (CFRs) ranged up to 100% (Table 3), but CFR was high for most of the study period. IR was high during 1926–1927 but declined after that timeframe (Table 3). The highest observed IR was from the Kul Kara settlement in Mangystau oblast in 1926. During that outbreak in mid-August, the death of a child led to person-to-person spread of infection. By September 20 of that year, 41 of 72 persons living in the village had died of pneumonic plague, and other cases were registered in different villages in Buzachi Peninsula of the oblast. At that time, Mangystau oblast had 12,300 residents (9,12,13,15,16).
We analyzed the number of outbreaks and percentage of affected population during the study period. We found that that 31 outbreaks were registered in the Mangyshlak desert NPF, accounting for 13.4% of all plague cases during the study period. In the Priaralie Karakum NPF, 17 foci and 8.8% of plague cases were registered. In the Ural-Emba desert NPF, 11 foci with 2.7% of cases were reported. In the Priustyurt desert NPF, 6 outbreaks occurred and 1.8% of the population was infected. In the Kyzylkum desert NPF, plague infected 1.1% of the population during 5 outbreaks. In the Ustyurt desert NPF, 4 outbreaks occurred, and plague infected 8.1% of the population. In the North-Priaral Desert NPF, 4 outbreaks occurred, and 31.7% of the population was infected. The Volga-Ural sandy NPF only had 1 outbreak, in which 0.2% of the population was infected. One major outbreak occurred in the Iliysk intermountain NPF, where plague infected 22.3% of the population. Two outbreaks occurred in the Pribalkhash desert NPF, where plague affected 9.9% of the population.
Cases of plague among humans were registered in places with stable epizootic plague activity (Figure 10, panels A, B). Mangystau oblast had the most outbreaks, and Almaty and Aktobe oblasts had the fewest (Figure 10).


